Emissions and how we are working to reduce them to a minimum
Greenhouse gases like methane, PFCs and CO2 contribute to global warming, ozone depletion and climate change. We have made an inventory of our Scope 1, 2 and 3 emissions which strengthens our understanding of the greenhouse gas (GHG) emissions in our value chain. This is a step towards managing emissions-related risks and opportunities and reducing value chain GHG emissions. Of all the greenhouse gases identified, CO2 is the most important one.
Curious to hear what our goals are at Stahl?
We target to reduce scope 3 upstream emissions by at least 25% within 10 years. Learn more about our full ambitions here.
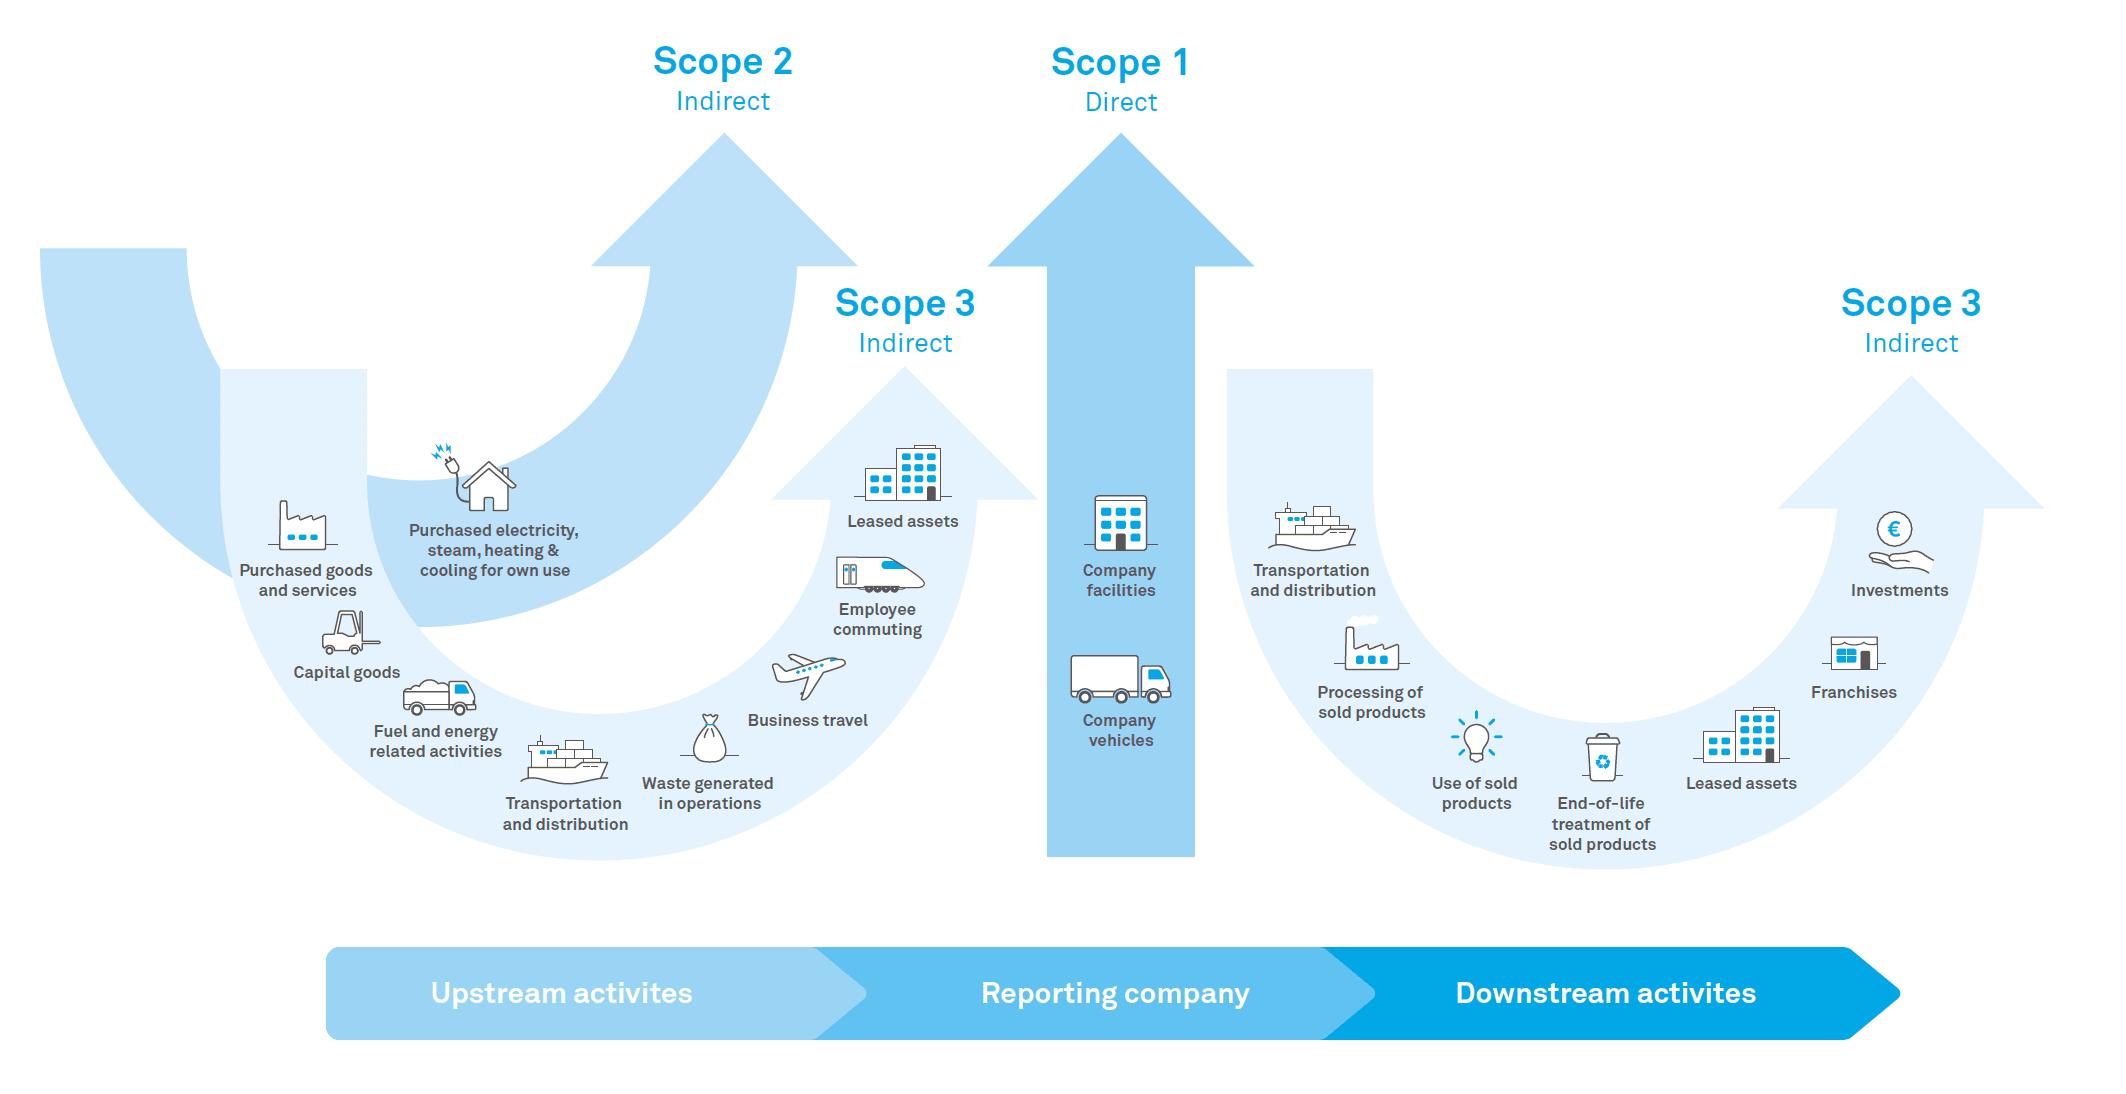
What is direct and indirect CO22 emissions (Scope 1, 2 and 3)?
Our manufacturing sites emit CO2 by burning fuels like gas, furnace oil and briquettes. Our people also travel by car and plane and our products are shipped by air, rail and road. We also emit CO2 indirectly when we use electricity generated elsewhere that might have caused CO2 emissions.
We calculate these different sources of CO2 emissions in line with the GreenHouse Gas (GHG) protocol. You can find them in the table below.
Our CO2 intensity of our scope 1 and 2 emissions –CO2 emission per tons of product that we produce – improved compared the previous years. Our absolute total CO2 emissions have grown because of acquisitions in the last years.
Scope 1: Direct GHG emissions are those from sources owned or operationally controlled by the company: company owned or leased cars, other company vehicles and gas and oil used on site.
Scope 2: Electricity indirect emission sources are those that occur through buying in energy (electricity, steam, heat and cooling) from the grid or district heating or cooling systems.
Scope 3: All other indirect emission sources.
Read our 2023 ESG report
GRI’s definition of Emissions
The GRI standard Emissions addresses emissions into air, which are the discharge of substances from a source into the atmosphere. The greenhouse gas emissions a major contributor to climate change.